Bottom line: HRV is the single most useful metric for tracking recovery. A high HRV means your nervous system is ready to perform. A low one means back off. Here’s what it actually measures and how to use it.
What HRV Actually Measures
Heart rate variability measures the variation in time between consecutive heartbeats. If your heart beats at 60 bpm, that doesn’t mean it fires exactly every 1000 milliseconds — the gaps between beats vary slightly, and that variation is what we call HRV. Higher variation generally signals a well-recovered, adaptable nervous system. Lower variation signals stress, fatigue, or incomplete recovery.
It sounds counterintuitive — why would inconsistency be good? Because the variation reflects your autonomic nervous system balancing two competing states: the sympathetic (fight-or-flight) and the parasympathetic (rest-and-digest). When you’re well-recovered, both systems are active and the heart responds fluidly. When you’re stressed or overtrained, the sympathetic system dominates and the rhythm becomes more rigid and mechanical.
What Affects HRV
Almost everything. The factors with the biggest impact:
- Sleep quality and quantity — the single biggest driver. A bad night drops HRV more than almost anything else
- Training load — hard sessions suppress HRV for 24–72 hours; this is normal and expected
- Alcohol — even one or two drinks measurably suppresses HRV the following night
- Illness — HRV drops before symptoms appear, making it an early warning system
- Stress — psychological stress has real, measurable effects on HRV
- Hydration and nutrition — dehydration and under-fueling both suppress it
- Age — HRV naturally decreases with age; comparing to your own baseline matters more than population averages
How to Actually Use HRV Data
The biggest mistake people make is treating single-day HRV readings as meaningful. They’re not — day-to-day variation is normal and expected. What matters is your 7-day rolling average compared to your personal baseline, and whether that trend is moving up, down, or staying flat over weeks.
A useful rule of thumb: if today’s HRV is more than 10–15% below your rolling average, treat it as a recovery day — reduce intensity, skip HIIT, prioritize sleep. If it’s at or above your average, you’re cleared to push. This isn’t a rigid system, but it adds a physiological data point to a decision you’re already making by feel.
HRV Numbers: What’s “Good”?
HRV is highly individual. A competitive athlete might average 80–100ms. A sedentary person might sit at 25–40ms. Neither number is inherently better in isolation — what matters is whether your number is trending up (improving fitness and recovery) or trending down (accumulating fatigue or overtraining).
This is why comparing your HRV to published averages is mostly useless. Track your own baseline for 4–6 weeks before drawing any conclusions. The trend over time is the signal. A single number is just noise.
Best Devices for HRV Tracking
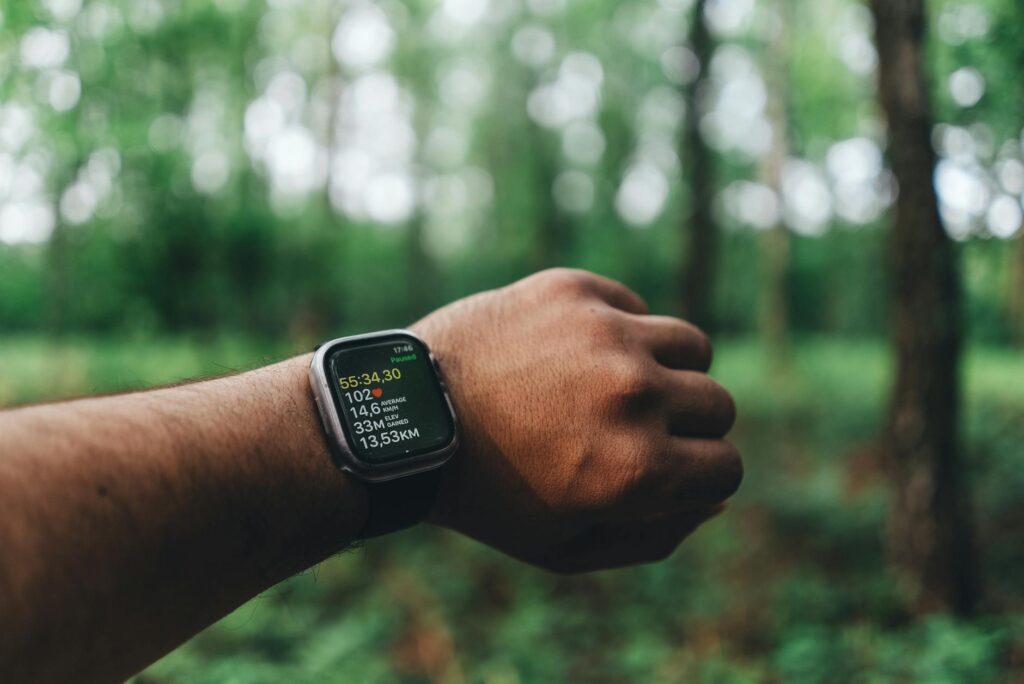
Not all wearables measure HRV the same way. The Oura Ring 4 measures HRV across the full night and produces the most consistent overnight readings of any consumer device. WHOOP measures HRV during your lightest sleep phase and also tracks it during daytime. Garmin devices measure it overnight and give you a morning readiness score. All three are solid — the differences are in methodology and what the app does with the data.
Where to Buy
Best overnight HRV accuracy — $349 + $5.99/month
Where to Buy
Best for athletes — from $239/year
Related Reading
Reviewed by
Marcus Webb
Recovery & Wearables
Spent years dealing with overtraining before getting serious about recovery data. Has tested nearly every wearable on the market and believes the best tracker is the one you actually respond to — not just the one with the best specs.
How HRV Is Measured
Consumer wearables measure HRV using photoplethysmography (PPG) — optical sensors that detect changes in blood volume through the skin. The sensor shines infrared light into the skin and measures how much bounces back; blood volume changes with each heartbeat create detectable variations in the reflected light. From this signal, the device calculates the time between successive heartbeats (R-R intervals) and computes RMSSD — the root mean square of successive differences — which is the standard HRV metric used by consumer devices including WHOOP, Oura Ring, Garmin, and Apple Watch.
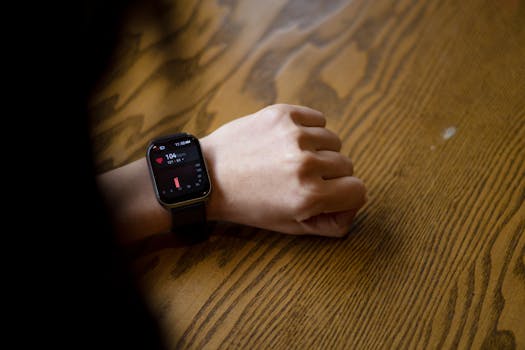
Finger-based measurement (Oura Ring) produces cleaner PPG signals than wrist-based measurement because the digital arteries in the finger are closer to the surface and less susceptible to motion artifact. This is why Oura Ring’s HRV data is generally more consistent and less noisy than wrist-based trackers. Chest strap electrodes (Polar H10) measure actual electrical signals from the heart and are the most accurate consumer HRV measurement method — used as reference equipment in research validation studies of wearable devices.
What Counts as a Good HRV
HRV is highly individual. Population norms range from roughly 20ms to over 100ms RMSSD, but these numbers are nearly meaningless in isolation because your personal baseline is the only relevant reference. A reading of 45ms might be excellent for a 45-year-old sedentary person and concerning for a 25-year-old elite athlete. This is why all consumer HRV devices spend the first 2–4 weeks establishing your personal baseline before generating readiness scores — the score is always relative to you, not to a population chart.
In general terms: higher HRV indicates better cardiovascular fitness and recovery capacity. Endurance athletes typically have higher HRV than the general population due to greater parasympathetic tone. HRV naturally declines with age — a 50-year-old with average fitness will have lower absolute HRV than a 25-year-old with average fitness. The practical implication: never compare your absolute HRV number to someone else’s. Track your own trend over weeks and months. That trend — improving, stable, or declining relative to your baseline — is the actionable signal.
HRV and Overtraining: The Early Warning Signal
Overtraining syndrome is characterized by sustained sympathetic nervous system dominance — the body stuck in a stress response it cannot recover from. The earliest measurable signal of this state, often appearing 2–4 weeks before performance declines or conscious symptoms of fatigue, is a sustained downward trend in morning HRV. Athletes who track HRV consistently and respond to multi-day HRV suppression by reducing training load avoid overtraining. Those who ignore sustained HRV drops and continue pushing often find themselves in full overtraining syndrome, which can take weeks to months to fully reverse.
This predictive capacity is the most compelling reason for serious athletes to track HRV. The recovery score on any given morning is useful. The trend over two to three weeks is far more powerful — it is the difference between catching a problem before it affects performance and realizing something was wrong only after performance drops.
Frequently Asked Questions
What is a normal HRV reading?
Population norms for RMSSD range from roughly 20ms to over 100ms, but individual variation is so large that population comparisons are nearly meaningless for personal decisions. What matters is your personal baseline — established over 2–4 weeks of consistent measurement — and how your current readings compare to it. A reading of 40ms might be excellent for a 50-year-old and below average for a trained 25-year-old.
Does HRV decline with age?
Yes — HRV naturally declines with age at roughly 1% per year after the mid-20s, driven by reduced parasympathetic tone and cardiovascular stiffening. However, regular aerobic exercise substantially slows this decline. Endurance-trained older athletes typically show HRV values comparable to much younger sedentary individuals. This is one of the physiological mechanisms underlying exercise’s well-documented cardiovascular longevity benefits.
Can stress management improve HRV?
Yes, and this is well-documented. Interventions that directly engage the parasympathetic nervous system — slow diaphragmatic breathing, meditation, yoga, and HRV biofeedback — consistently improve resting HRV in controlled studies. The effect is cumulative: 15–20 minutes of slow breathing (5–6 breaths per minute) practiced daily for 4–6 weeks produces measurable RMSSD increases. This is one of the few recovery interventions where the mechanism is understood and the evidence is robust.
The Bottom Line
HRV is the most information-dense single number your body produces about its current state. It integrates sleep quality, training stress, life stress, illness, and recovery into one morning signal that, once you have established a personal baseline, becomes a reliable guide for training decisions. The athletes who use it best treat it as a trend signal rather than a daily report card — acting on multi-day patterns rather than individual numbers, and using it to identify the lifestyle factors that move their recovery most. Two months of consistent tracking will show you something specific about your physiology that no generic recommendation could tell you.
The right decision comes down to your specific training goals, device ecosystem, and budget. Use this guide as a framework, not a formula — every athlete’s situation is different, and the device that serves your specific combination of needs is the one worth buying. If you are still undecided after reading, the safest starting point is always the device with the lower cost of entry: you can always upgrade once you have identified the specific gaps your current tool is not filling.
Related:complete HRV guide